Landmark Pie Chart
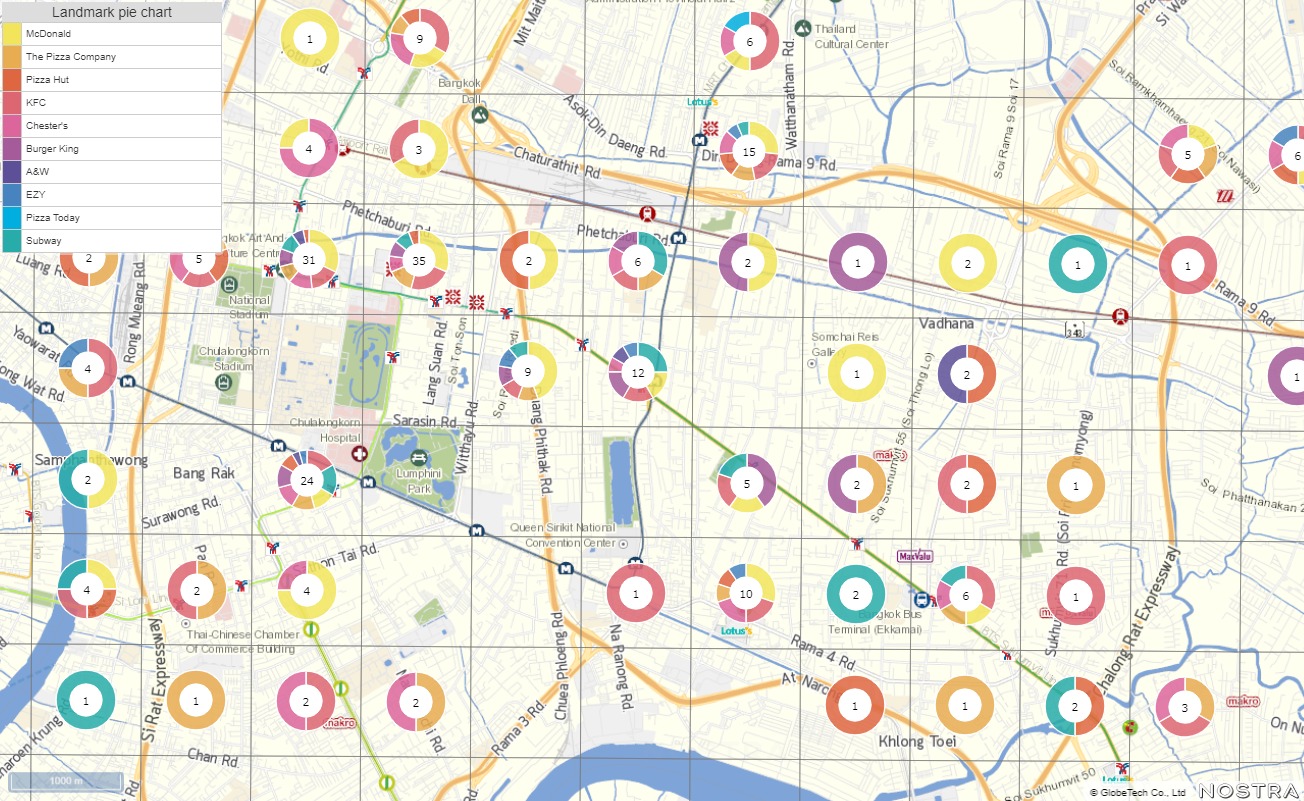
The selected landmark data is automatically aggregated and a pie chart is displayed. You can visualize market share within the same category.
If you want to use data from another category, you can do so by registering as My Landmarks.
TerraMap Thailand can display landmark pie charts with 1km, 10km, and 100km meshes.
What is Pie Chart?
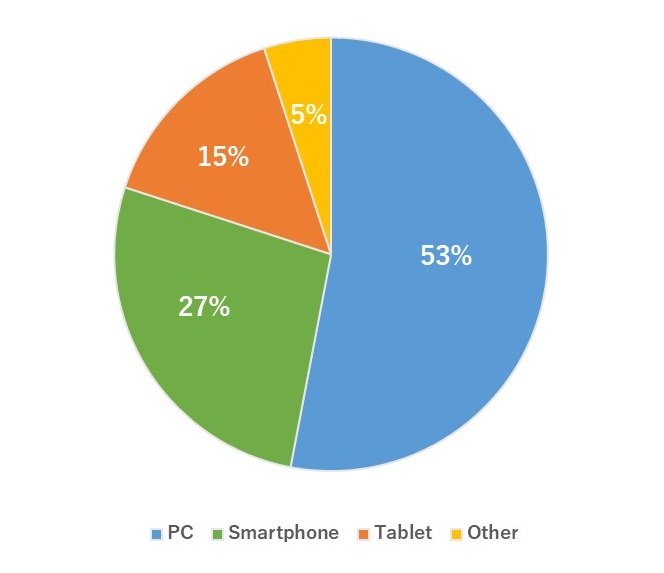
Pie Chart is a graph in which a round figure is divided into sectors. It is suitable for showing composition ratios.
For Example:
・Share of sales and number of units sold
・Questionnaire results of what they saw when visiting the store, such as PCs and smartphones
These data can be visualized.
Use Case:Characteristics of store opening area
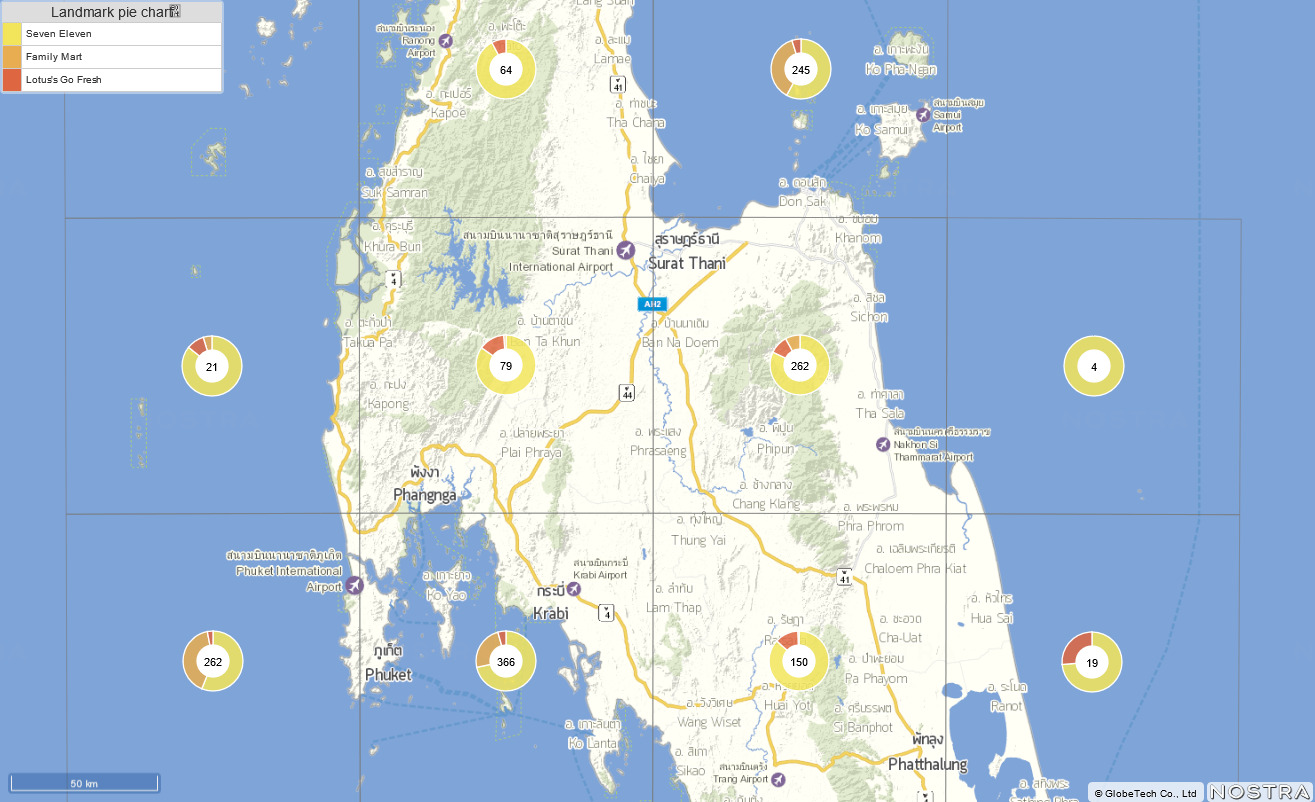
It shows the number of stores of the three convenience store chains. You can see the difference in the ratio of store opening depending on the area.
You can check what areas your competitors are opening stores in.
You may be able to see the characteristics of the area and the target of each company.
Use Case:Check service method
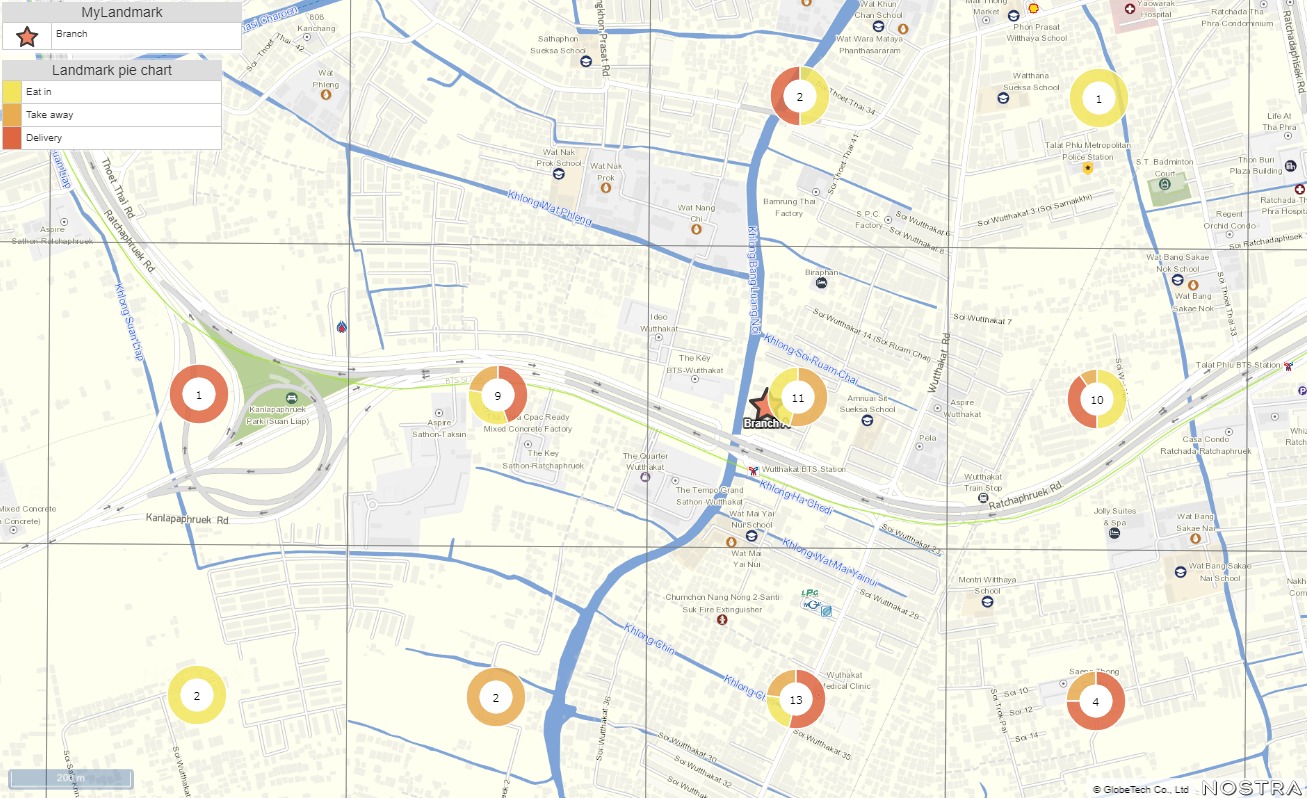
You can check different category data and customer data using MyLandmark.
Plotting customer data by “eat-in “, “take-away”, and “delivery”, may show you characters depends on the locations.
Please use this information for sales promotion along with other data such as population or topographical conditions
For your first Area Marketing GIS!Please request a document to help you understand TerraMap Thailand.