Know your strong and weak areas
Step 1:Where are your customers from ?
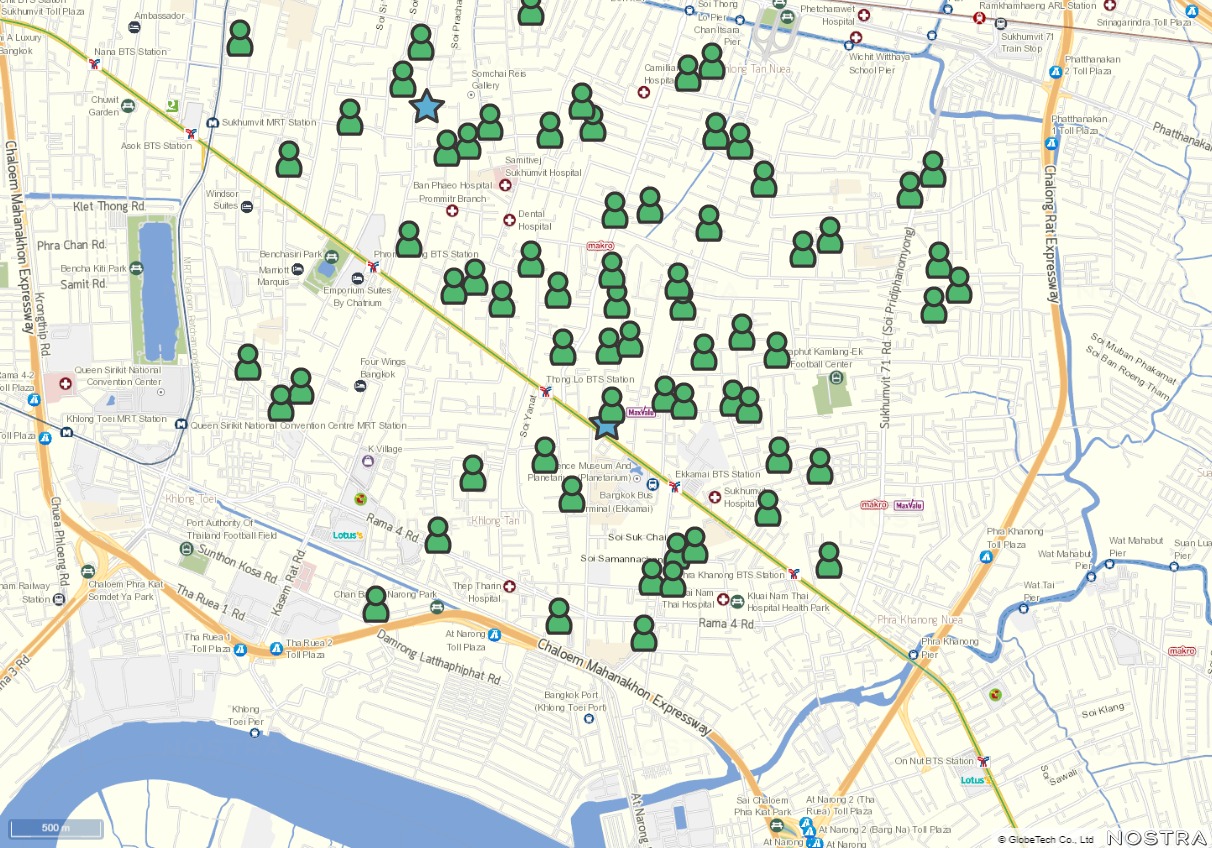
By visualizing customer data on a map, it is easy to see where customers are coming from.
You can see various information such as few visits from near that competitor’s store, and no visits across large arterial roads and rivers.
Step 2:Find your strong and weak areas
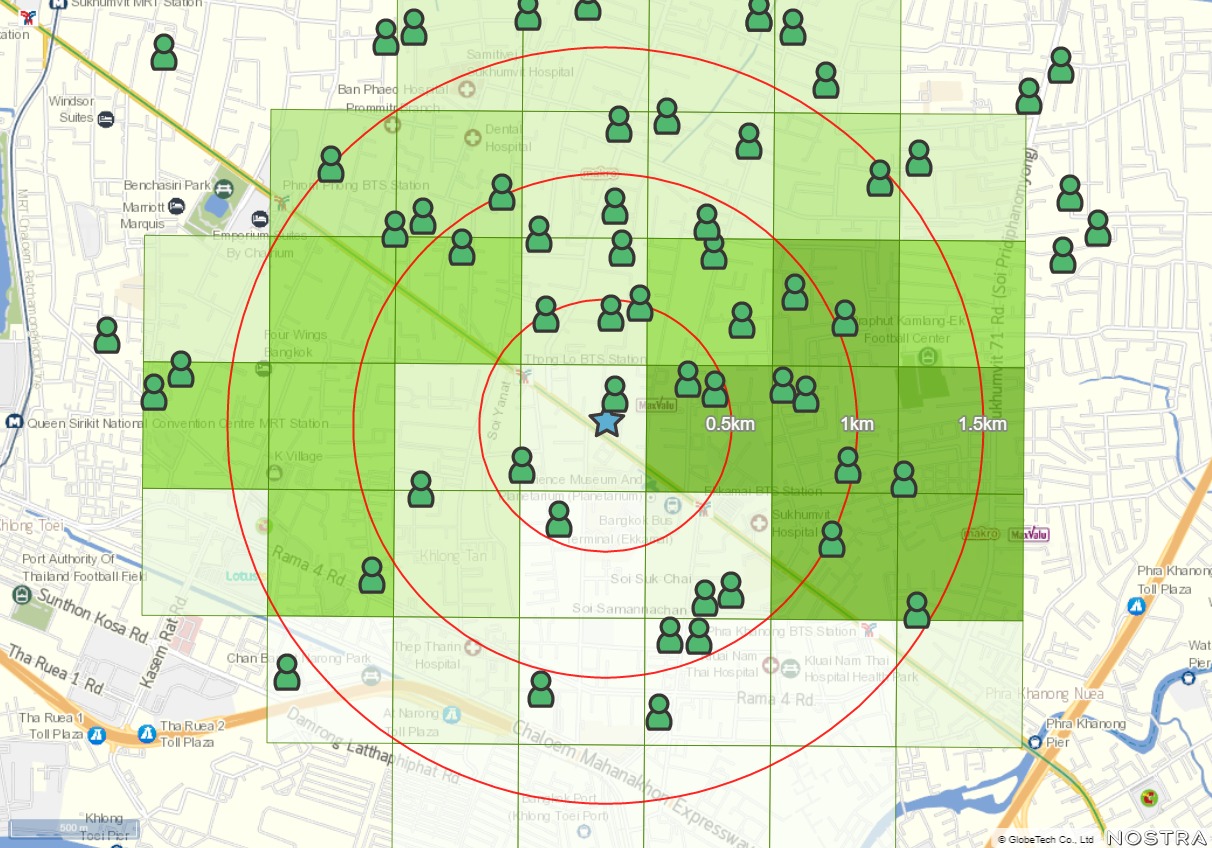
By using population and household data, it is possible to see strong areas and weak areas at a fine level in which administrative world.
For example, you can display in color the target population and population ratio to visually see the difference from the plotted data distribution
For your first Area Marketing GIS!Please request a document to help you understand TerraMap Thailand.
Request Document