New data information and maintenance – February 20th (Mon)
February 13, 2023
Data will be updated on February 20th (Mon).
Continue reading “New data information and maintenance – February 20th (Mon)”
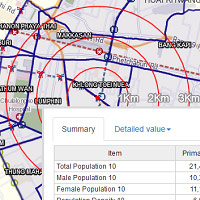
One click report
August 22, 2017
Make an automated report with 1-click. Quickly make a commercial report and improve your efficiency.
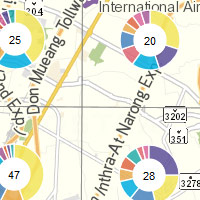
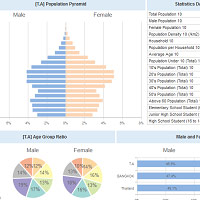
Landmark pie chart
August 22, 2017
Automatically calculate data and display pie chart of selscted landmarks. Visualize market share of landmarks within the same category.

My Landmark
August 22, 2017
You can use your own data for analysis. Building new marketing strategy is possible by analyzing your own store data, competitors, and customer data.

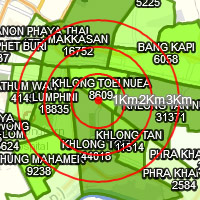
Color range
August 18, 2017
commercial areas can be colored based on statistic data to visualize population distribution.

Grid data
August 18, 2017
500m grid data is available. It is originally estimated based on population and household data of sub-districts (Tambol level).
Administrative data
August 18, 2017
Loaded with Sub-district level data for all over Thailand. Suitable for area marketing such as store development